Realti Intel turns live MLS data into forward-looking market intelligence, so you price with precision, advise with authority, and walk into every listing appointment with an edge no one else in the room has.
Direct MLS PIN integration15-minute data refreshTown-level precision, not metro averagesMost agents are up in under 5 minutes
Built on live MLS PIN data, the same feed used by every licensed Massachusetts agent, analyzed and scored across 70+ towns. Calibrated to how MA agents actually work. Every module tested in real listing appointments before it shipped.
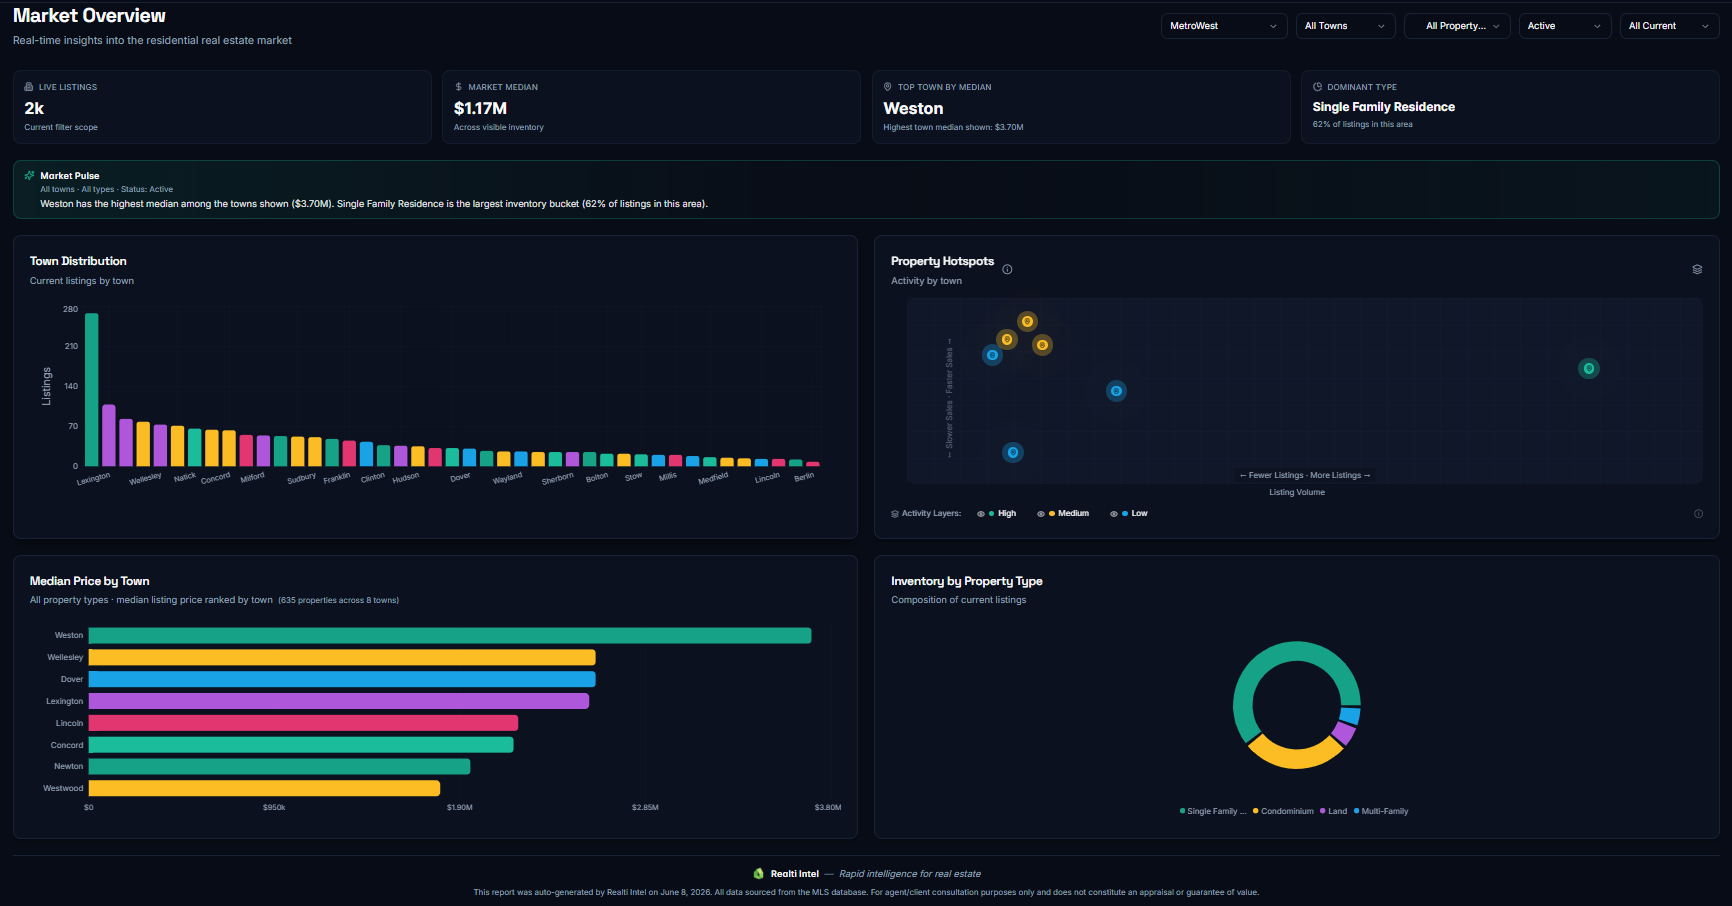
Market Overview
See every market at a glance
Live inventory, median prices, town distribution and property hotspots — updated in real time.
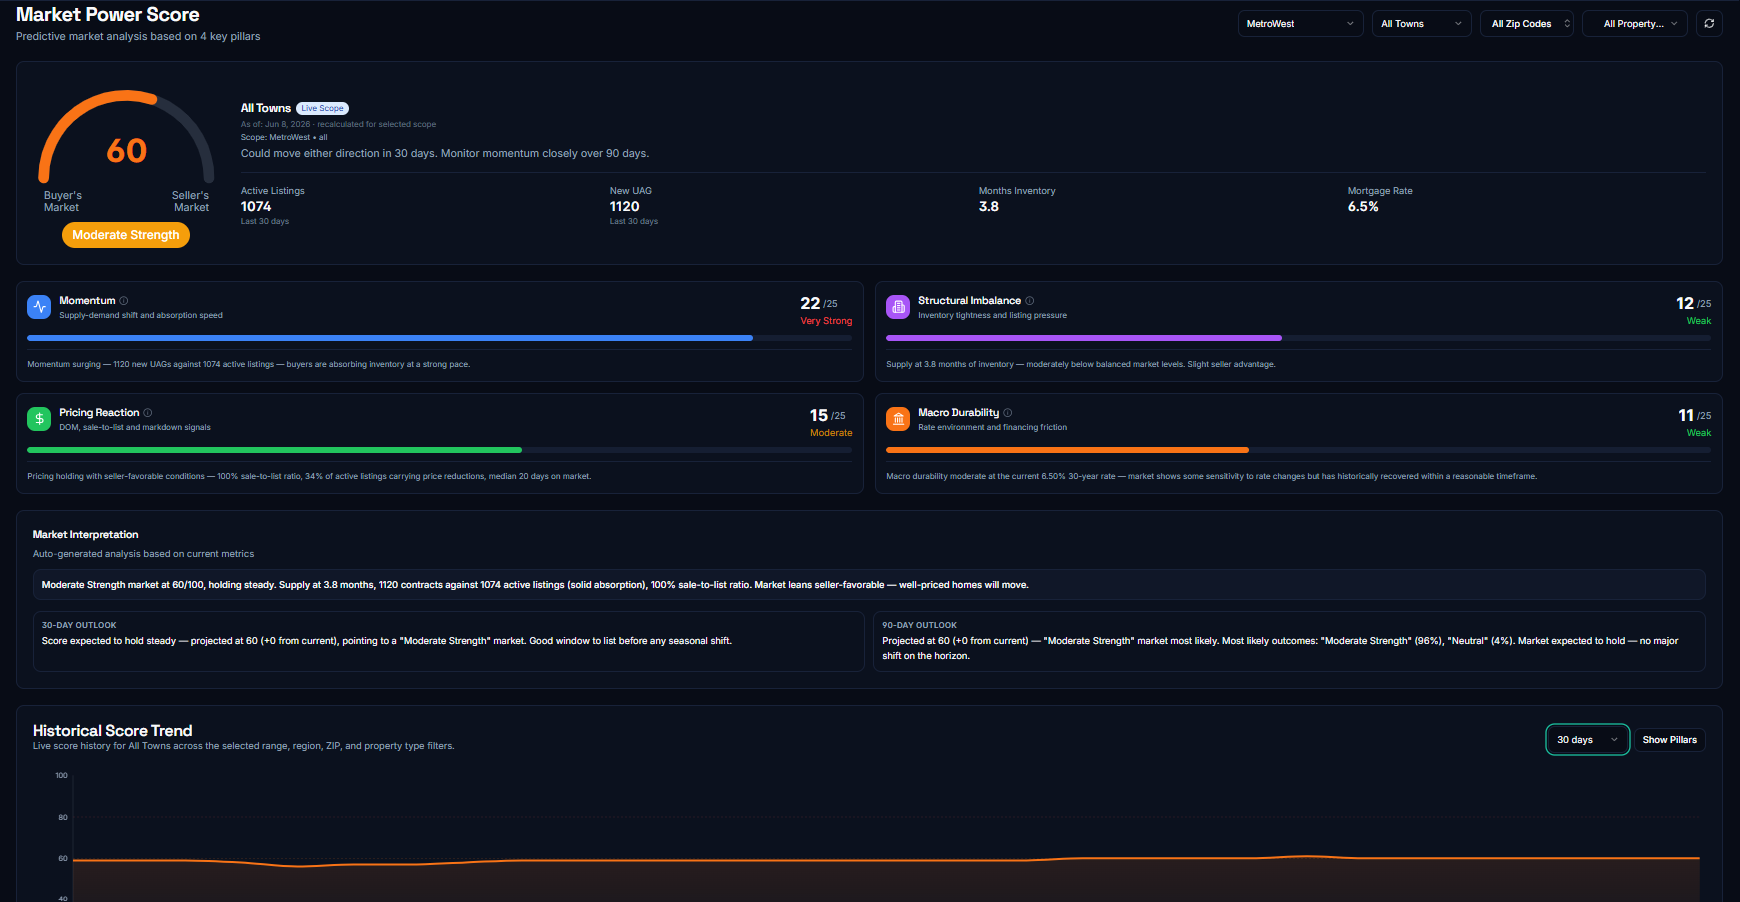
Market Power Score
Know exactly how strong your market position is
A composite score across pricing, velocity, and demand signals — so you walk into every appointment with conviction.
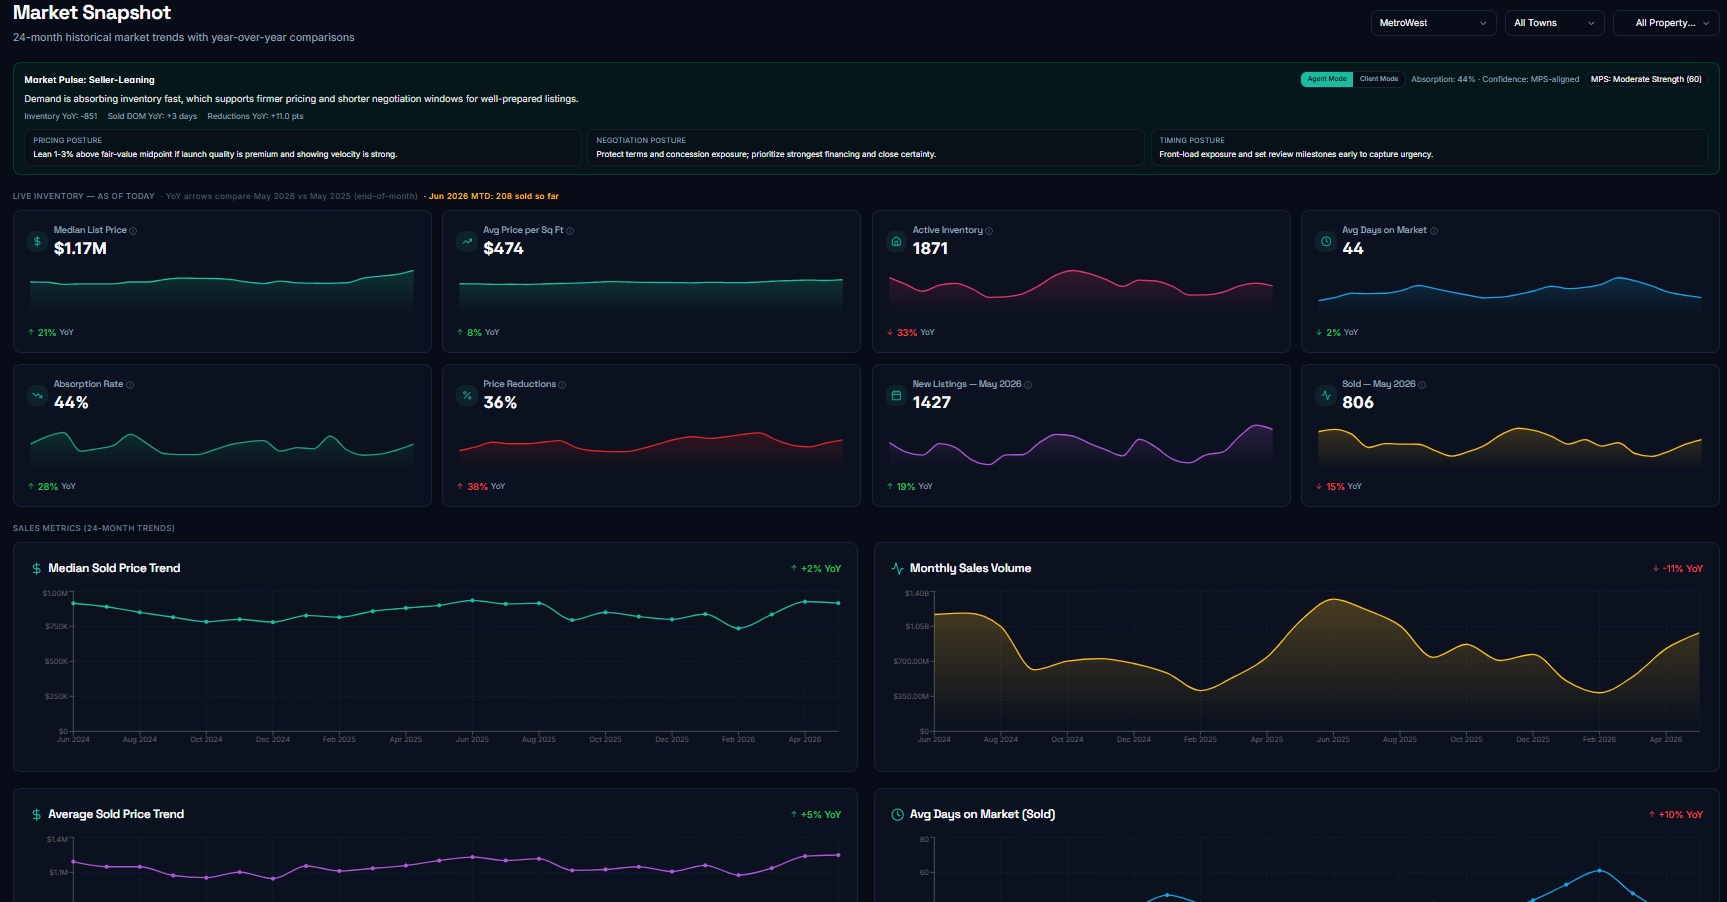
Market Snapshot
Your market briefing, ready in seconds
KPIs, trends, and competitive context for any town — exportable and client-ready.
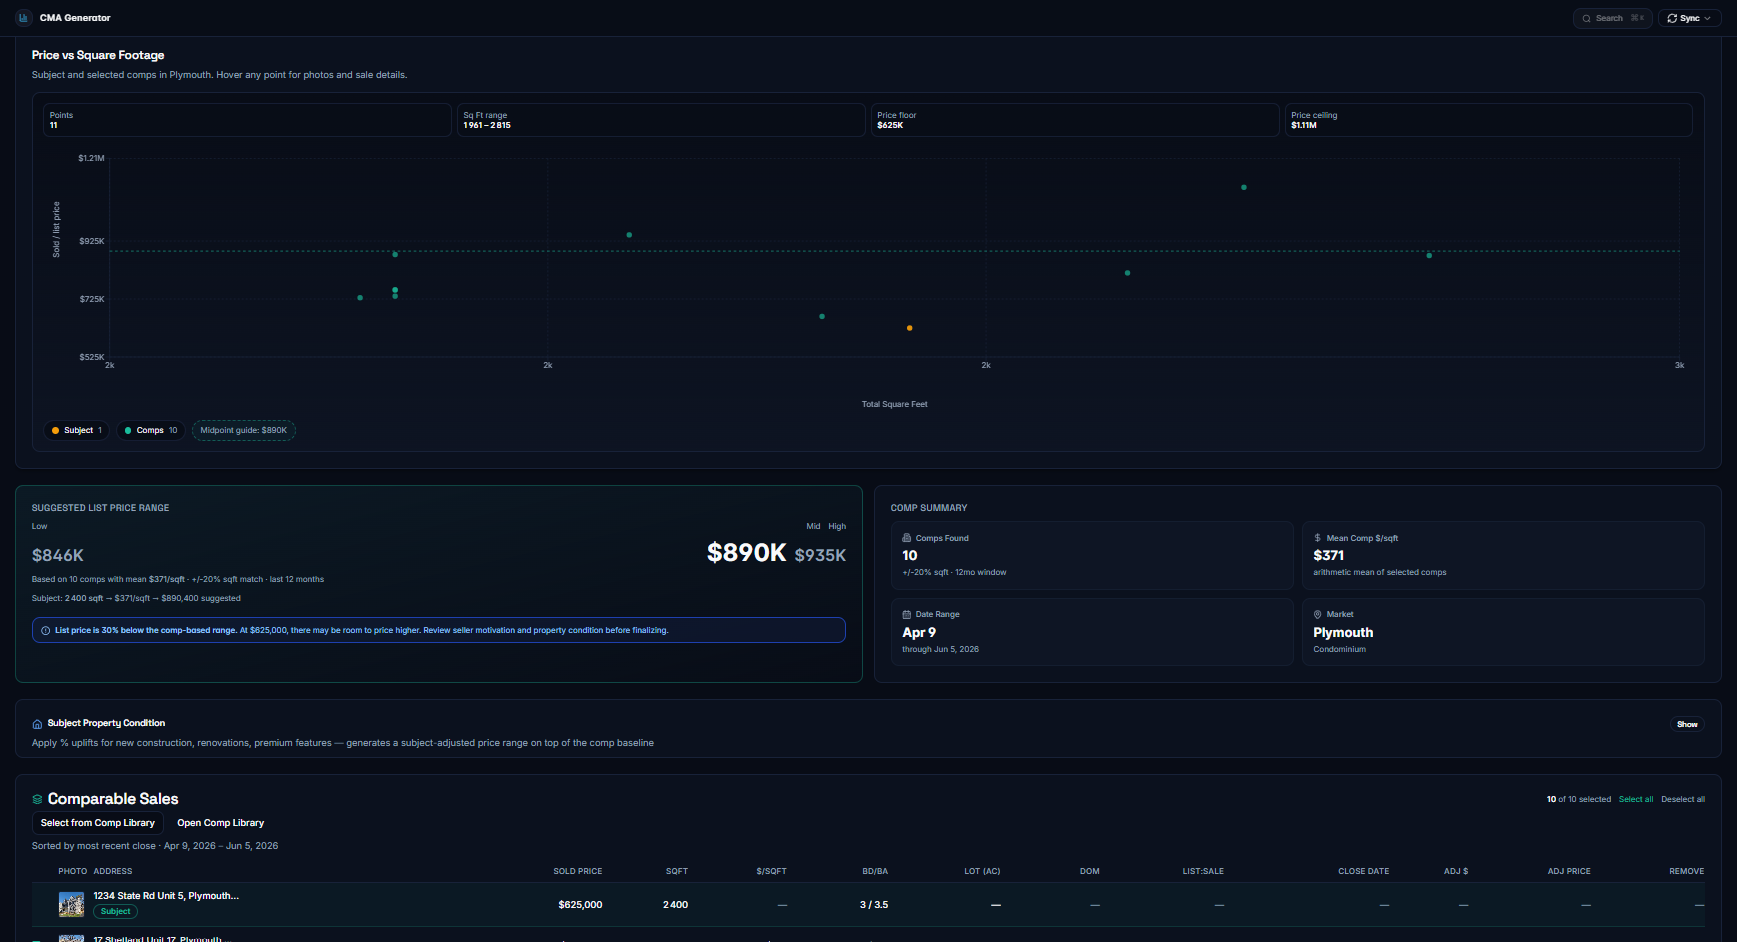
CMA Generator
A professional CMA in minutes, not hours
Comps pulled automatically, adjustments made intelligently, PDF exported instantly. Download a real sample below.
Most agents are working from the same information. Lagging by weeks.
By the time a market shift shows up in everyone's data, it's already happened. The agents who didn't see it coming are the ones explaining it after the fact.
What most agents use
Lagging comps. Closed sales from 90 days ago describe a market that no longer exists. You're pricing today with yesterday's data.
What most agents miss
Direction, not position. Where the market is heading matters more than where it's been. Agents working from static snapshots can't see momentum.
What it costs
Real money. Every 10 days at the wrong price costs a Wellesley seller $33,124 in expected proceeds. That gap is the cost of guessing.
WHO THIS IS FOR
Built for agents who are expected to know before the market does.
The difference between good agents and top agents isn't effort. It's information. Realti Intel is for the agents who refuse to walk into any client conversation without knowing more than anyone else in the room.
That's not instinct. That's a data advantage.
Listing agents pricing high-stakes homes
Where a mispriced week costs $33K in lost proceeds
Agents advising clients in uncertain markets
Where "I think" isn't good enough and the data settles the room
Top producers who can't afford to "feel it out"
Every room is a reputation moment. You need certainty, not confidence
Professionals who want data, not opinions
Where your pricing recommendation is irrefutable, not debatable
HOW IT WORKS
Three steps. Under five minutes. Walk in knowing.
We handle the data. You handle the conversation.
01
Live Data Engine
We pull directly from MLS PIN and normalize the data in real time. Select your town and property type, Wellesley, Single Family, and every module recalculates instantly. The intelligence is already there. You just told us where to focus it.
10 seconds
02
Market Intelligence Layer
We transform raw data into forward-looking signals: demand momentum, supply pressure, pricing behavior, rate sensitivity. The Market Power Score tells you who has leverage, and every signal maps to a recommended action, so you walk out knowing exactly what to do, not just what the market is doing. That's certainty, not confidence. There's a difference.
2 minutes
03
Decision Interface
You see exactly what's happening, and where it's going, instantly. Price from the $/sqft anchor. Check the seasonal score for the optimal window. Pull the top opportunities for your buyer. Close the platform and walk into the room knowing more than anyone else in it.
Three situations every Massachusetts agent faces. Here's how Realti Intel changes the outcome.
USE CASE 01
Pricing a listing.
You're pricing a home in Wellesley. The sellers have a Zillow estimate. Their neighbor "got $200K over ask in 2022." They want to list at $3.5M. You know the market is somewhere else entirely, but comps aren't the whole argument.
You show them the DOM cost calculation: every 10 days at the wrong price costs $33,124 in expected proceeds. At $3.5M, the risk of overpricing by 10% is a $99K DOM penalty.
You don't argue with the sellers. The data argues for you. You price it right. It sells in 14 days.
You price with confidence, not risk.
USE CASE 02
Advising a buyer who won't commit.
Your buyer has been looking for 6 months. They've lost two offers. Now they're paralyzed, unsure whether to keep going or wait for the market to shift. Every week they don't decide costs them.
You open Seasonal Intelligence for Wellesley. July scores 97/100 for buyers, the highest month of the year, 6 points above the MetroWest baseline. Sellers are more motivated, competition is structurally lower, and the data says now is the window.
You show them the chart. "The data says July is your month. Not because it's quiet, because motivated sellers are priced to move. If we're not in contract by August, we wait until January."
You become the advisor, not the messenger. They make an offer that week.
USE CASE 03
Winning the listing appointment.
You're competing against two other agents for a Wellesley listing. They're both bringing printed CMAs. The sellers have never heard of you. You have one meeting to prove you know this market better than anyone.
You bring three pages.
Page one: the Market Power Score (54, Balanced Negotiation, not the Seller Advantage they were told). Page two: the $/sqft anchor from 517 transactions over 24 months, with the 6-month trend. Page three: the DOM cost analysis, what overpricing by 10% actually costs them in net proceeds.
The other agents brought twelve pages of comps. You brought three pages of intelligence they couldn't challenge.
You got the listing. That's the whole story.
THE PLATFORM
Ten intelligence modules. Every decision, covered.
Every module is built around a specific decision you face in the room. This is where you stop guessing.
Know exactly how strong your market position is — a composite score across pricing, velocity, and demand signals.
portal.realtiintel.com
Live inventory, median prices, town distribution and property hotspots — updated in real time.
portal.realtiintel.com
Your market briefing, ready in seconds. KPIs, trends, and competitive context for any town — exportable and client-ready.
portal.realtiintel.com
Comps pulled automatically, adjustments made intelligently, PDF exported instantly.
Write the right offer, not just the highest one. Real offer intelligence for every market condition.
portal.realtiintel.com
Market Power Score
One number that tells you who has leverage, before the listing appointment
Distills a town's entire market condition into a single 0–100 composite index, one number to lead with, four pillar breakdowns to back it up when someone pushes back.
Measures demand vs. supply imbalance in real time
Tracks momentum shifts before they appear in comps
Four-pillar breakdown tells you exactly where the leverage is
Market Dashboard
The full picture, active, pending, sold, in a single live view
Live read on any covered town: active inventory, new listings, pending contracts, sale velocity, 24-month trends, all in one view, updated every 15 minutes from the MLS feed.
Absorption trends and days-on-market compression
Price reduction patterns and over-asking percentage
Sale-to-list ratios filtered to today's market cycle
Filter instantly by Single Family, Condo, Multi-Family
Market Opportunities
Surface the listings worth pursuing, ranked and tiered before you call
Scans your covered markets and surfaces the highest-opportunity listings ranked by tier: A, B, and C, based on pricing position, DOM trend, seller motivation signals, and market context.
Opportunities ranked by tier across all covered towns
Pricing position relative to current market conditions
Seller motivation signals, DOM outliers, price cuts, relists
Updated daily so you're always working the freshest list
Property-Level Intelligence
Enter an address. Get the full story, not just what sold, but what it means
Enter any address. Get a full intelligence brief: listing history, DOM pattern, price reductions, comparable sold properties, and the live market context for that exact town and property type.
DOM cost impact, $33,124 per 10 days in Wellesley SFR
How similar homes are performing right now
Full listing history with price reduction timeline
Adjust strategy in real time, not after the fact
Property Status Insights
Track what's changing, price cuts, relists, and status shifts in real time
Surfaces the signals other agents miss: properties with price reductions, expired and relisted homes, extended DOM outliers, and status changes that reveal motivated sellers before they're obvious.
Price reduction tracker by town and property type
Expired and relisted properties with full history
Extended DOM flags, identify motivated sellers early
Status change alerts for markets you're watching
Valuation Suite
Every valuation scenario covered, residential CMA and condo building analysis
Two precision tools in one module. The standard CMA delivers a client-ready report in under 60 seconds. The Condo Building CMA goes deeper, unit-to-unit comparisons within the same building, with unit-level adjustments for floor, exposure, and finish quality.
CMA anchored to 24 months of actual MLS closed data
Three clean pages you can hand across the table
Condo Building CMA: floor, exposure, and unit-level adjustments
Exportable PDF for both formats
Comp Library
Log your off-market data. Build a comp edge no one else has
The only comp tool that combines live MLS closed data with your own off-market transactions. Log private sales, off-market deals, and unlisted comps, then use them alongside MLS data for pricing accuracy that competitors running standard tools simply can't match.
Log and store off-market transactions for future comp use
Compare listings using both MLS and your private data
Filter by town, property type, price band, and date range
Export selected comps directly into your Valuation Suite CMA
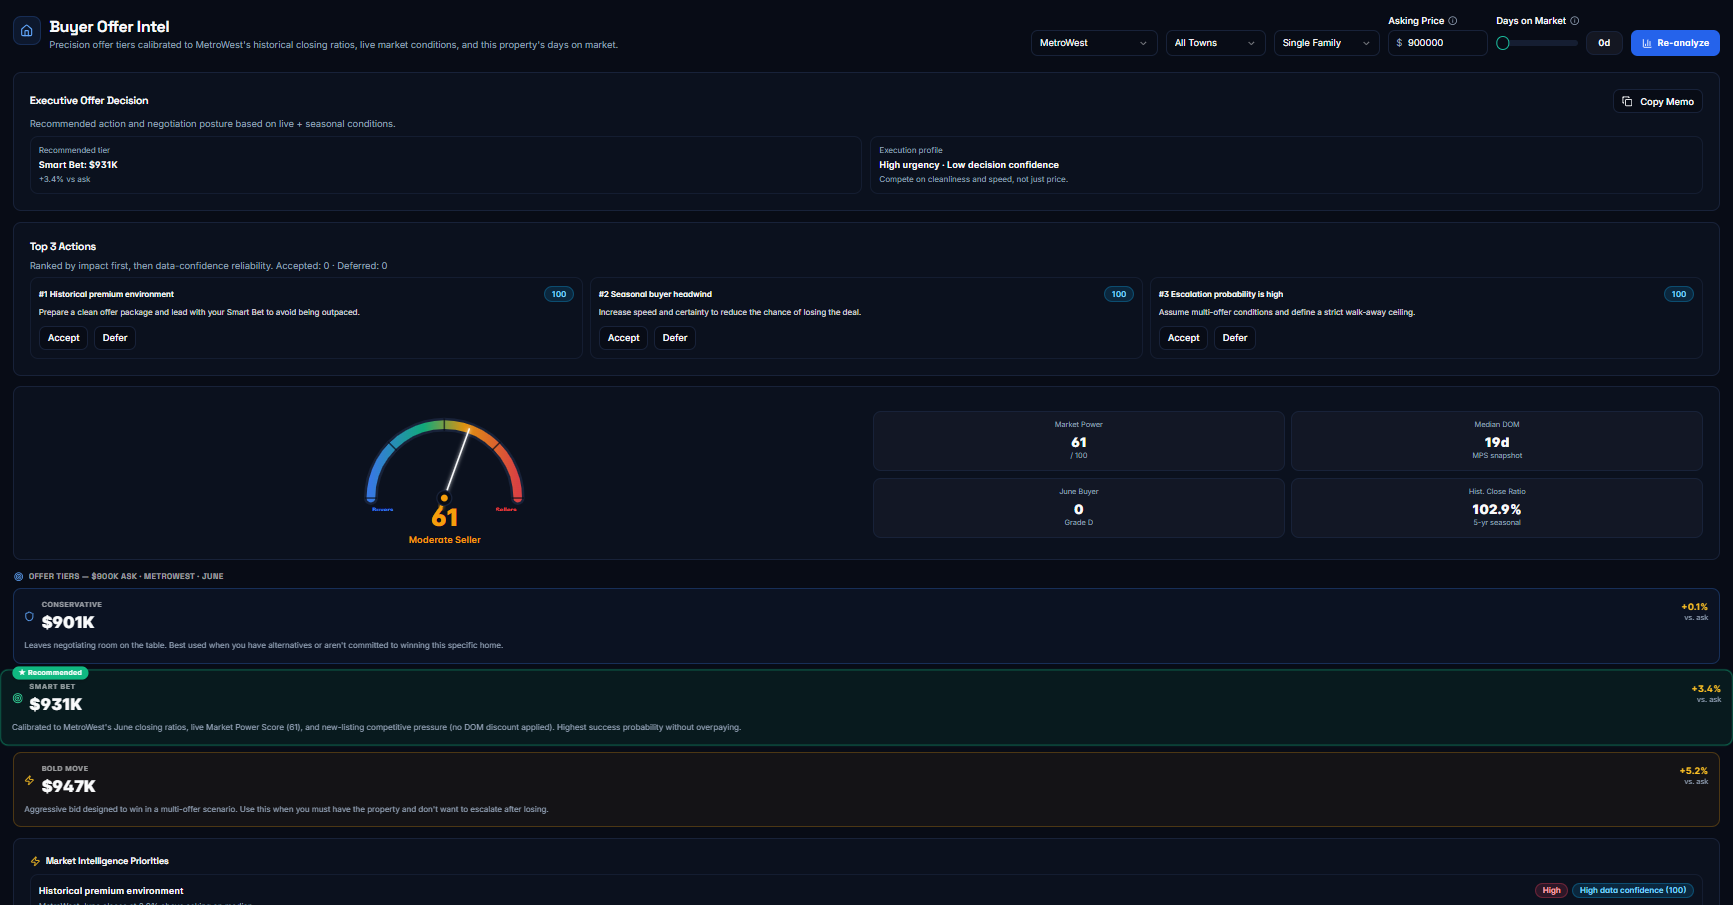
Offer Intelligence
Know what the market is actually accepting, before you write the offer
Goes beyond list price to show what offers are actually landing: over-asking rates, multiple offer frequency, accepted offer patterns by property type and price band, so you advise from data, not instinct.
Over-asking rate and average premium by town
Multiple offer frequency filtered to current market cycle
Accepted offer patterns by price band and property type
Helps buyers compete and sellers price to attract offers
Seasonal Intelligence
The best time to buy or sell, scored by month, backed by data
Scores every month of the year 0–100 for buyers and sellers, based on 24 months of historical market behavior in your specific town. Turn "when should I move?" from a guess into a data-backed answer.
Monthly buyer and seller scores for every covered market
Benchmarked against regional and statewide averages
Identifies the optimal list window before competitors see it
Gives clients a concrete reason to act, and act now
Financial Forecaster
Model the financial outcome, before your client makes the decision
Goes beyond market conditions to model the actual financial picture: projected proceeds, cost-of-waiting scenarios, and outcome comparisons that turn abstract market data into concrete numbers your clients can act on.
Project net proceeds based on current market conditions
Cost-of-waiting analysis, what delay actually costs in dollars
Scenario comparisons: list now vs. wait vs. price reduction
Turns your market intelligence into a financial conversation
COVERAGE
Starting in Massachusetts. Built to cover every market you work.
Built on MLS PIN, the largest MLS in New England, and expanding across all of it. Town by town. Region by region. Until every market you work is covered.
North ShoreSouth ShoreCape & IslandsMerrimack ValleyCentral MA+ more
"
I walked into that appointment knowing three things my competition didn't: the optimal list month, the exact $/sqft anchor, and the cost of overpricing per day. The sellers felt it immediately. We got the listing.
— Beta Agent, MetroWest MA
15 min
MLS data refresh cycle. Not 48 hours. Not daily. Every 15 minutes.
24 mo
Rolling closed transaction window, calibrated to today's market, not pandemic-era frenzy.
10
Interconnected intelligence modules. One platform. Every decision covered.
Stop guessing. Start knowing.
Founding access is limited per market. When your market fills, it closes.